
.webp)
The Maintenance Work That Never Shows Up in Your Roadmap
Your platform team set a standard six months ago. A new logging format. A required health check endpoint. A CI template every service should use. It's documented. It was announced in Slack. Everyone agreed.
Ask how many services actually follow it.
The answer is usually somewhere between 30% and 60%. Sometimes lower. Rarely higher.
This gap between what your platform team defines and what your codebase actually reflects is where maintenance burden lives. And it compounds.
Two Types of Engineering Debt
The first type is structural: legacy code, bad abstractions, missing test coverage. You invest the time to fix it and it's resolved.
The second type is operational. It describes the ongoing work required to keep your services current and your standards adopted: dependency upgrades, security patches, CI config updates, runtime migrations, API deprecations, tooling consolidation. This work never ends. It scales with your service count. And it resists the kinds of one-time fixes that resolve structural debt.
Most engineering leaders measure the first type. They feel the second type.
How Operational Maintenance Debt Compounds
In year one, you have 30 services and a platform team of three engineers. Maintenance is a manageable fraction of the workload. Your team builds.
By year three, you have 150 services. The platform team has grown to seven, but maintenance now consumes most of their capacity. The team that was building infrastructure is now running a maintenance treadmill.
This inversion happens for a predictable reason. Service count grows faster than headcount. Maintenance burden grows faster than service count because coordination overhead compounds. Every new standard that needs to be applied across 100+ services isn't just 100 units of work. It's 100 units plus the tracking, the follow-up, the blocker resolution, and the re-confirmation that the work actually got done.
One service requires roughly 7 hours of maintenance per quarter: dependency updates, security patches, config updates. At 100 services, the expected number is 700 hours. The actual number is closer to 1,400, because coordination overhead roughly doubles the cost.
That's 3.5 full-time engineers per quarter, just keeping dependencies current.
Standards That Get Set and Never Adopted
There's a specific failure mode that platform teams know intimately: the standard that exists on paper but not in the codebase.
A production readiness checklist is defined. Teams acknowledge it. Scorecards light up red. Six weeks later, 80% of services still haven't met the requirement. The platform team manually follows up with five engineering teams. Three respond. Two are stuck for different reasons. One merged the change but misconfigured it.
This isn't a people problem. It's an execution infrastructure problem. The standard is correct. The motivation exists. The missing piece is a way to push the change to every affected service as a concrete, reviewable unit of work, rather than a documentation request that competes with sprint priorities.
The Four Patterns That Create Maintenance Overhead
Dependency decay is the most familiar. A service launches with current versions. The team ships and moves on. Six months later it's two versions behind. Twelve months later, five versions. At eighteen months, a routine update requires a major refactor because breaking changes accumulated across skipped versions. What would have been 2 hours per service per quarter becomes 20 hours plus bug triage. Deferral multiplies cost by a factor of three to ten.
Config drift follows a similar pattern at the org level. A standard config template is defined. Teams copy and customize it. The template is updated. Now 80 repos run slightly different configs, each with local variations. Every platform change must account for five variations instead of one. Every new standard requires 80 individual migrations that each need to be tracked, verified, and sometimes corrected.
Security patch treadmill hits hardest when you have a large service footprint. A CVE drops. 100 services need patching. The next month, another CVE. Each cycle consumes 20 to 40 hours of coordination on top of the technical work. Security patches alone account for 240 to 480 engineering hours per year. That's two to five months of one engineer's time, just for security remediation, not including other maintenance.
Tooling fragmentation multiplies everything. Three teams pick three different test frameworks. The platform team now maintains three configurations, three upgrade paths, three sections of onboarding documentation. Every platform improvement requires three implementations. Standardization is straightforward to decide and expensive to execute.
Why Scorecards Surface the Problem but Can't Solve It
Maturity scorecards are a meaningful step forward. They make the gap visible. When a service is red on production readiness, there's a concrete signal to act on, a clear owner, and a measurable outcome.
The problem is that a scorecard check is a measurement, not an execution mechanism. Seeing that 60 services fail a health check endpoint requirement tells you the scope of the problem. It doesn't move any of those 60 services toward compliance.
The work that follows is manual: create tickets, communicate the requirement, wait for engineers to prioritize it against their sprint work, follow up with the ones who haven't started, resolve the questions from the ones who are blocked. That coordination is where maintenance hours disappear.
What scorecard data is exceptionally good at is defining the change precisely. When OpsLevel flags a service against a standard, the requirement is unambiguous. The validation logic is already written. The affected services are already identified. The missing piece is executing that change as pull requests across every affected repo, rather than relying on manual org-wide coordination.
What Platform Teams Actually Need
The execution gap between a defined standard and a compliant codebase has three components: creating the change in every affected repo, coordinating the review and merge, and tracking adoption until it reaches 100%.
Automation handles the first component well. Scripts can create PRs, run tests, and push to GitHub. That addresses roughly 20% of the total work.
The remaining 80% is coordination. Getting PRs reviewed. Identifying which updates are security-critical versus low-priority. Finding which PRs have been open for three weeks. Following up with teams who haven't reviewed. None of that is handled by a script. It's handled by a person, manually, repeatedly.
Effective maintenance execution requires automated creation of PRs across every affected repo, team notification with context (not just noise), real-time visibility into which services are updated and which are stuck, and adoption tracking through to completion. Most platform teams achieve execution. Few achieve coordination.
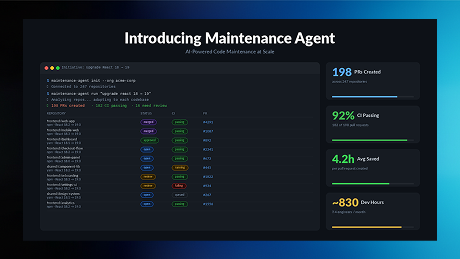
OpsLevel Maintenance Agent: Closing the Execution Gap
OpsLevel's Maintenance Agent connects your service catalog and scorecard data to coordinated, org-wide execution.
When a standard is defined in OpsLevel and services are flagged against it, the Maintenance Agent takes the affected service list and opens reviewable pull requests across every repo. Your CI validates each change. Your engineers review before anything merges. Nothing ships without human approval.
The coordination layer is the part that changes the math. The Maintenance Agent tracks adoption in real time, surfaces blockers without waiting for a weekly standup, and notifies teams with the context they need to act, not just a notification that a PR exists.
Platform teams using the Maintenance Agent move from weeks of manual tracking to reviewing a dashboard showing adoption at 80% and rising.
The change is defined. The scorecard already identified the affected services. The CI already runs. The engineers are already reviewing PRs. The only missing piece was a system designed to coordinate execution at org scale.
What Gets Unlocked
When operational maintenance overhead drops from 35-40% of platform team capacity to something manageable, the roadmap changes.
Major architectural improvements that were perpetually deferred get scheduled. Developer tooling investments that couldn't compete with maintenance toil get prioritized. The platform team stops functioning as a maintenance coordination team and starts functioning as a platform team.
The strategic cost of operational maintenance debt is invisible until you calculate what your team would have built with the hours it spent on coordination last quarter.
That number is worth knowing.
OpsLevel gives engineering organizations a unified service catalog, automated maturity scorecards, and a Maintenance Agent to execute standards at org scale. If your platform team is spending more time coordinating maintenance than building, see how the Maintenance Agent works.

Subscribe
Join our newsletter to stay up to date on features and releases.
By subscribing you agree to with our Privacy Policy and provide consent to receive updates from our company.

