Introducing OpsLevel
Explore all of the features and functionality that OpsLevel has to offer.
What is OpsLevel?
OpsLevel is an internal developer portal that helps you ship high quality software, faster. We help you to achieve this by improving visibility of your context using our catalog, promoting and tracking org-wide and team-based standards, and empowering developers to automate or self-serve more tasks to help them stay in flow. With OpsLevel, engineering teams can move faster without sacrificing quality and best practices.
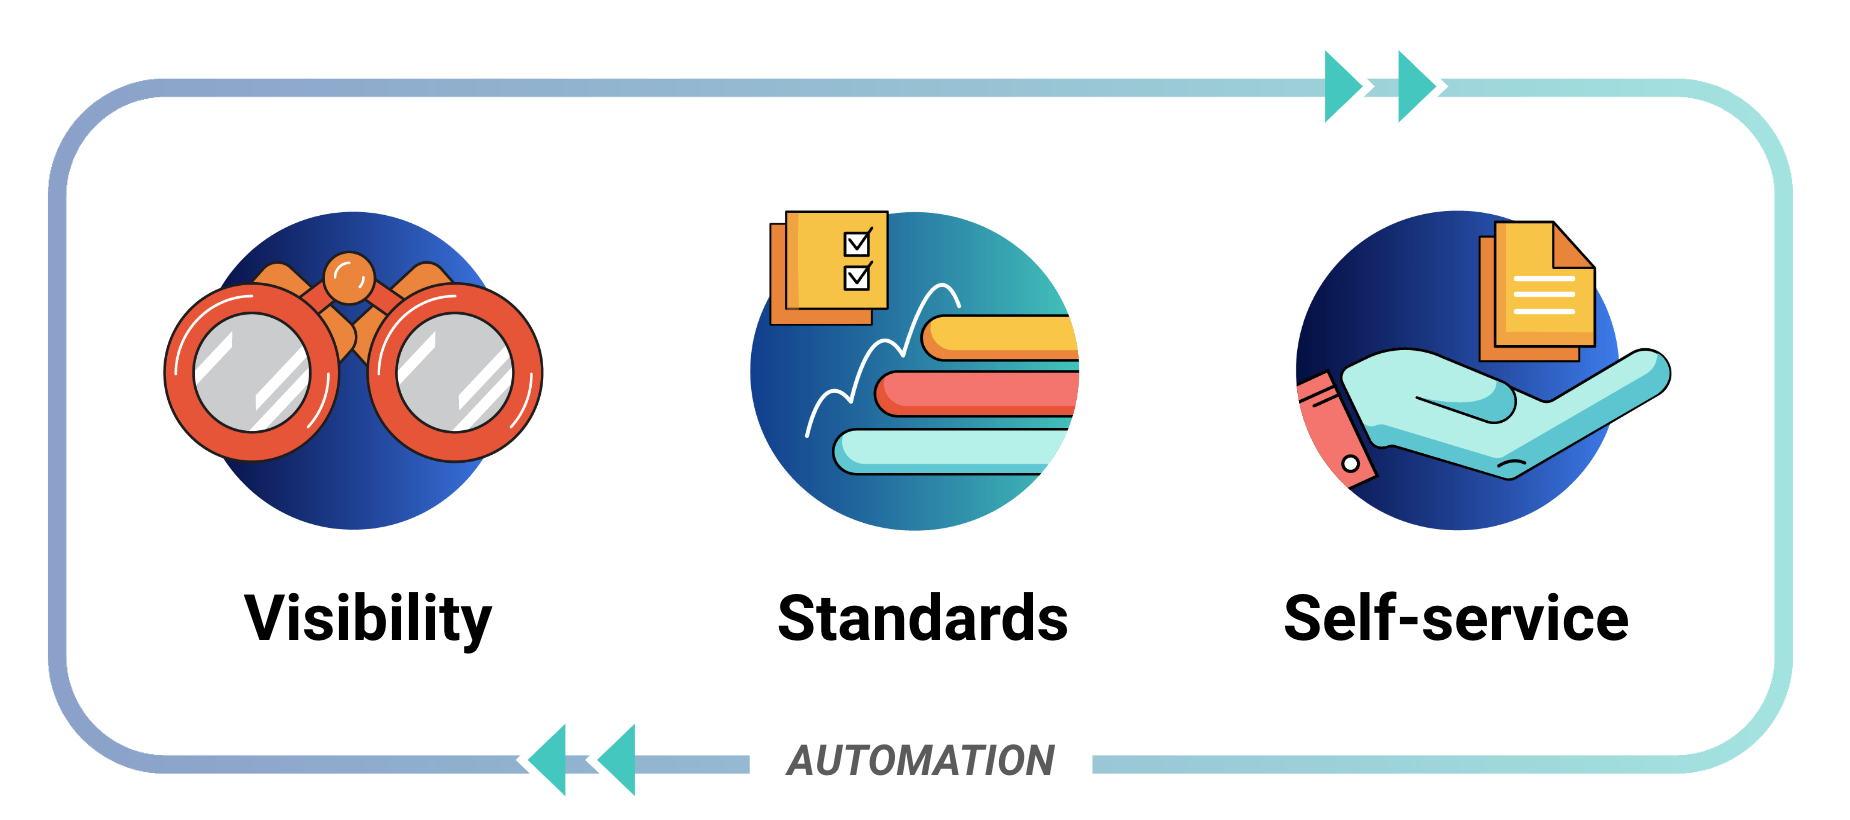
OpsLevel's three pillars of an internal developer portal are visibility, standardization and self-service, on a foundation of automation.
Create visibility using our Catalog
As engineering organizations grow in scale and complexity, it's easy for context to be forgotten or to lose track of components and who owns them. Tribal knowledge will only carry your teams so far. OpsLevel's Software Catalog provides automation and tools to help your teams stay up-to-date with the components they own and information about the services that they depend on.
The OpsLevel catalog has first-class support for many features
- Tracking for all of your Services, Systems, and Domains.
- Tracking for your infrastructure (databases, serverless functions, and more…).
- Hosting for your OpenAPI/Swagger documentation.
- Powerful search for your project-specific Markdown files.
- Your deploy history at a glance.
- A visualization of the dependencies between your services.
- Tracking who’s on-call for a service by integrating with PagerDuty.
Track standards with OpsLevel's Service Maturity Framework
Getting an accurate view into the quality of your code at a glance can be difficult. But even harder is tracking the gradual adoption of initiatives across your various projects. Want to know how many services use an outdated version of Ruby? For that, we’ve built a robust Service Maturity tracking system.
Key elements of OpsLevel's Service Maturity framework include:
- Automated checks that can streamline acquiring key information about the quality or configuration of a service
- A Rubric and Scorecards that provide structure to your checks, making it easy for service owners to understand how their checks correlate to one another and roll up into an overall Service Level.
- Campaigns that make it easy drive and measure the progress of adopting new standards, upgrading libraries or other initiatives.
- Aggregated reporting across all of your services, teams and domains.
Empower developers with self-service
OpsLevel provides a suite of tools to help automate routine tasks that developers would otherwise do manually. Not only does this save time, but it also provides a layer of auditing and security. Creating more opportunities for self-service within your organization can help your teams maintain flow state and avoid unnecessary toil or burdensome interruptions due to uneccessary cross-team communications.
OpsLevel allows you to:
- Automate common tasks like provisioning new infrastructure or updating secrets through Actions.
- Create new projects from templates using our Service Creation.
Try it yourself
Not already a customer, but want to test it out for yourself? Start a free trial.
Updated 7 months ago
Check out our blog on the criteria for an effective IDP or start diving into our guides on maturity or repositories in OpsLevel.